Back in 1912, an Italian statistician named Corrado Gini developed a method to measure what would eventually become maybe the defining feature of modern life: inequality.
The method, essentially, rates the equality of a society on a scale of 0 to 1. At zero, everyone in that society earns the same amount of income. At 1, one person earns all of the society’s income for himself.
It has become the go-to method for determining the wealth distribution in modern economies. Per a 2022 study from the Organization for Economic Cooperation and Development, the United States has the fifth-highest Gini coefficient among measured countries, while Slovakia’s economy is the most evenly distributed.
Where am I going with this? Well, another Italian data whiz, Roberto Angioni, just used Gini’s method to measure the inequality in the English Premier League by looking at how many points the first-place team has compared to its maximum (three points per game), the second team (win every game except the games against the first-place team), and etc. And while the Premier League remains more unequal than any OECD nation, its Gini coefficient (52.5%) is lower than it has been in any of the past nine seasons. (For comparison, the next lowest league among Europe’s Big Five leagues is LaLiga, up at 56.7%.)
The story, then, remains the same as the last time we did this: the Premier League is more competitive than ever before. So, let’s break out the second edition of ESPN’s monthly Premier League Power Rankings to try to make sense of it all.
– Ranked: Top 50 USMNT players by club form for 2026 (so far)
– Do Premier League summer transfers need extra patience?
– Why is Champions League so easy for Premier League teams?
How the Premier League Power Rankings work
For a longer discussion of the methodology, please refer back to our first edition of the rankings. This is the goal:
These aren’t meant to be the most accurate power rankings in the history of power rankings — the goal here is to create something that is simple and intuitive but still has some predictive power. The value comes from comparing the rankings to the table, seeing what looks different, and trying to pry apart the reasons why.
We’re keeping the formula relatively simple. It includes four inputs for each team: (1) the roster’s estimated market value per Transfermarkt, (2) the non-penalty expected goal differential, (3) passes allowed per defensive action or PPDA, a measure of pressing intensity, and (4) pass-completion percentage outside of the final-third, a measure of a team’s ability to withstand opposition pressure.
Here’s how things look at the end of February:

 1. Arsenal (unchanged)
Since we last did this, Arsenal have dropped seven out of a possible 18 points: a loss to Manchester United and draws to Brentford and Wolves.
If Manchester City win their game in hand, they’ll be only two points back and as everyone likes to say now: Manchester City “control their own destiny.” This phrase is ridiculous — by definition, destiny is not something you can control! — but what they really mean is that if Manchester City win all of their remaining matches, which includes one against Arsenal, they will win the league.
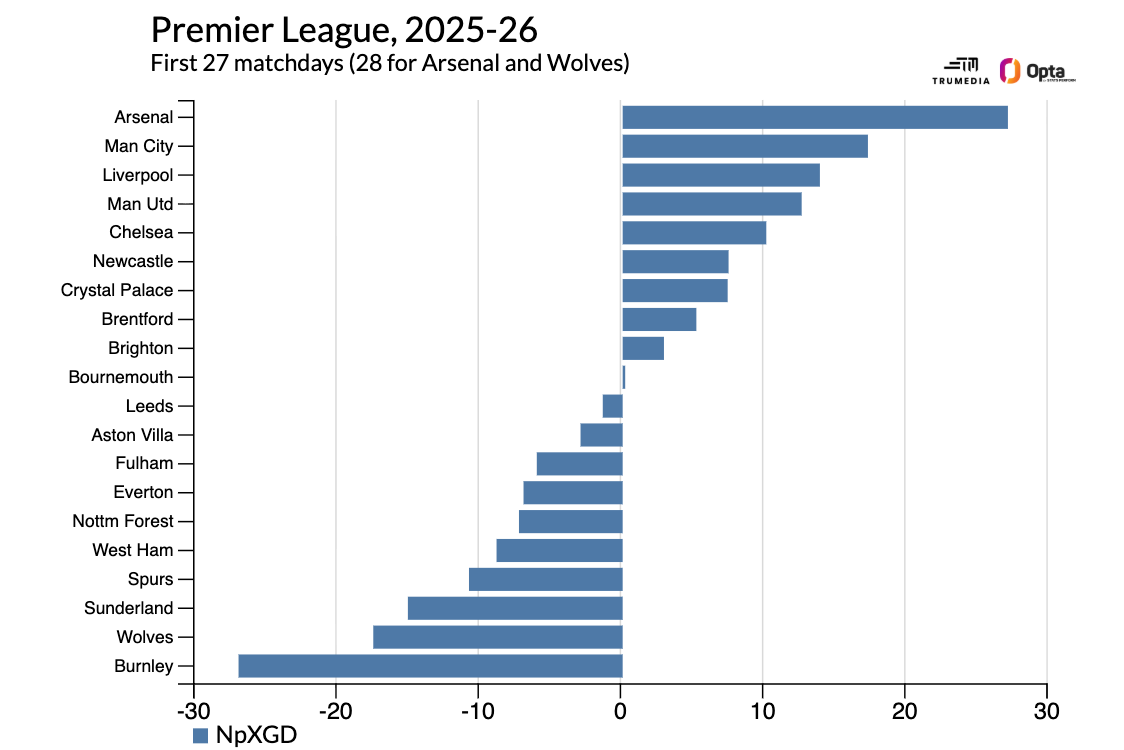
Yet while Arsenal were outplayed by Brentford, there aren’t many signs that things are falling apart at the Emirates. Granted, they’ve played one extra game, but Arsenal have posted the best expected goals differential in the Premier League over the past five matchdays:
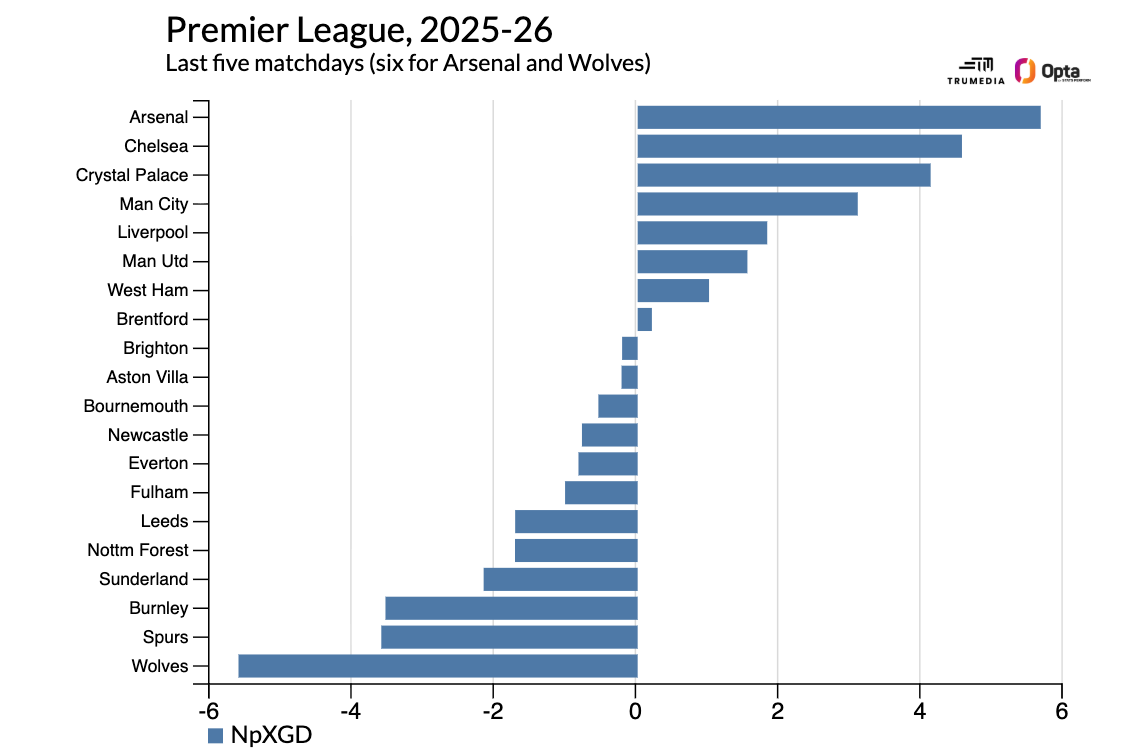
They’re still the best team in the league and they still have a multipoint lead on the team in second. Put those two things together, and they’re still the odds-on favorite to win the Premier League.
 2. Manchester City (unchanged)
While they’re still in second, their rating has ticked up somewhat. That’s mainly because I adjusted everyone’s market values after the January window, and Manchester City made multiple expensive signings last month. But they’ve also been a little more aggressive out of possession since then.
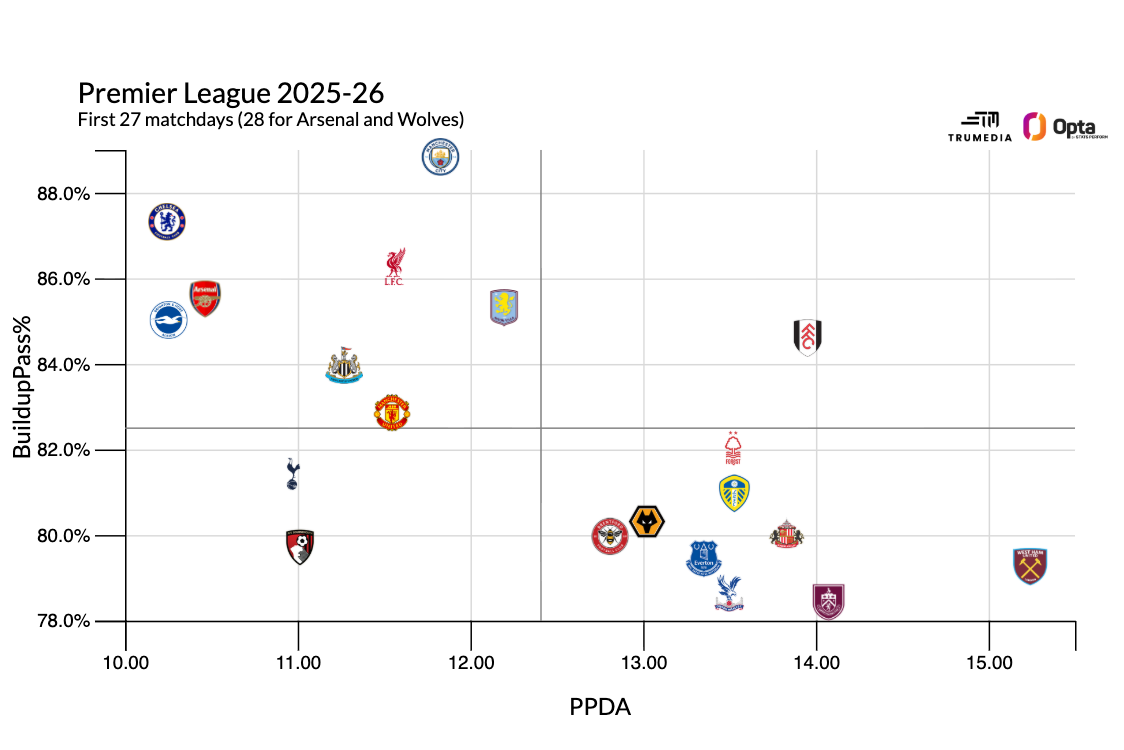
Here’s a plot of PPDA and buildup completion percentage over the last five games:
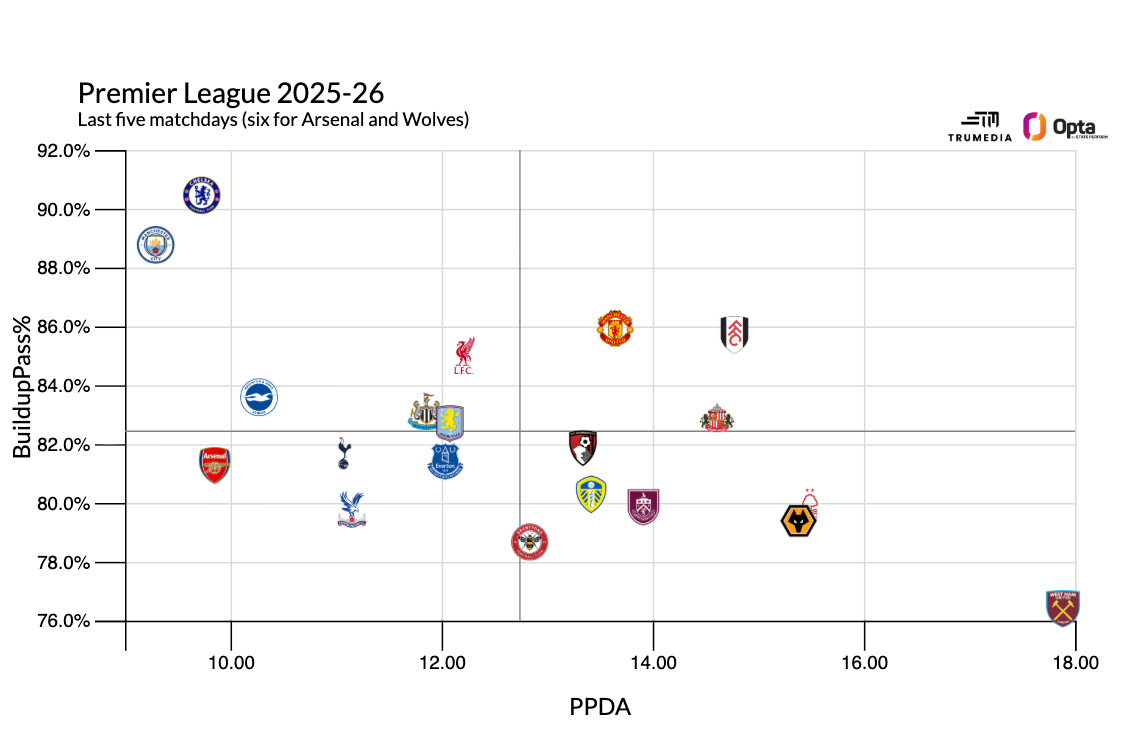
The lower the PPDA, the more aggressive the press, and City’s press has been on a long-term decline since Pep Guardiola took the helm in 2016.
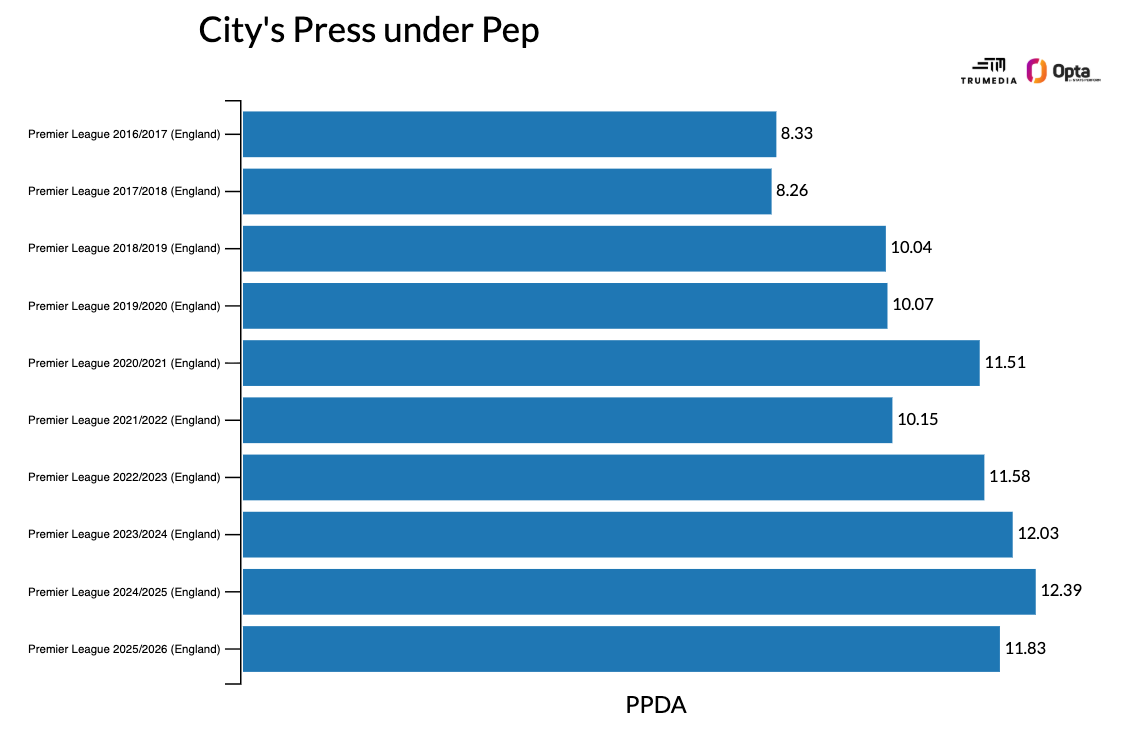
Perhaps the arrivals of Marc Guéhi and Antoine Semenyo will make City a little more robust higher up the field? I wouldn’t bank on it, but it seems as if it has been true for the past couple of matches.
 4. Liverpool (down 1)
Liverpool are something of the opposite of Chelsea. From now until May, these are their league matches:
• West Ham at home
• Wolves away
• Tottenham at home
• Brighton away
• Fulham at home
• Everton away
• Crystal Palace at home
They’ll likely be better-than-50% favorites to win all of those games, and it’s an opportunity to solidify a spot in the top five and even build up a cushion before the final month of the season, when they travel to United and Villa, host Chelsea, and wrap things up with Brentford at home.
 3. Chelsea (up 1)
As you can glean from the charts above, Chelsea are playing to the ranking system. Their tactics are doing what the model wants to see: pressing and avoiding the opposition press. And more recently, they’ve been outcreating their opponents to a significant degree. That was not happening when Liam Rosenior first arrived as coach, nor while Enzo Maresca was on the sideline.
Throw in a super-expensive squad, and we have a team that’s checking all of the boxes. But there’s one “but” here: the schedule. They still have to play every other team in the top six of these rankings, plus the team currently in third in the actual table, Aston Villa. If we take the average power rating of the remaining opponents for every team in the league, Chelsea have — by far — the hardest remaining fixtures.
 5. Manchester United (unchanged)
We’re six games into the Michael Carrick era, and he has United running at a plus-0.56 non-penalty xG differential — a decent improvement on the plus-0.35 rate ex-coach Ruben Amorim ran the team at for 20 games this season. I’m not convinced it’ll continue at this level, but a third of the games Carrick has managed have come against the two best teams in the league.
As for how he has changed things: Kobbie Mainoo is playing way more often, they’re pressing way less aggressively, and they’re controlling the ball more carefully in buildup play — the latter of which, ironically, was the worst thing about Amorim’s first season at the club.
 6. Newcastle United (unchanged)
They have three points from their past five matches, and they’re in 11th, but does anyone actually think they’re the 11th-best team in the league? Newcastle have produced a minus-1 non-penalty goal differential through 27 matches, despite this:
They’re probably too far back to make a real run at a top five spot, but they’re through to the round of 16 in the UEFA Champions League. I certainly wouldn’t want to play them.
 7. Brighton & Hove Albion (unchanged)
How is the 14th-place team in the table this high in the ratings? Funny enough, they’re eighth in goal differential (plus-2) and their xG differential is pretty much in line with those numbers, too. More than that, though, they play as if they’re a top team:
I’m not sure this maximizes their potential point total given their overall talent level, but by pressing and possessing the ball, Brighton are almost definitely increasing the transfer value of the players they have. If you’re a bigger team acquiring a Brighton player, you don’t have to worry about how they might translate into a team that plays a proactive type of soccer. You can just watch the tape or look at the numbers.
 8. Tottenham Hotspur (unchanged)
So, uh, yeah …
The rankings refuse to believe that a team with Tottenham’s talent can be as bad as its underlying numbers and Tottenham’s table position says they are. Transfermarkt rates Spurs as the fifth-most valuable roster after City, Arsenal, Chelsea and Liverpool. Except those valuations are overvaluing this team in two ways: (1) some of the players simply aren’t as good as their reputations suggest, and (2) this is one of the worst-built big teams in recent memory.
Most people who have watched even one soccer game would agree that “passing” is pretty important. Like, maybe the most important thing? Since “passing the ball” makes up the majority of what every player on the field does in a given match?
Yet the Tottenham hierarchy has acquired a bunch of players who are big or fast or big and fast. This is like deciding you’re going to get healthy and then doing a cold plunge every morning, taking a bunch of supplements … and never exercising, never eating whole foods, and making no effort at developing any meaningful relationships.
Per the grades from Gradient Sports, who have people who watch every pass that’s made in the Premier League every weekend, Tottenham have zero players in the top 50 for passing and only one (Cristian Romero, 53) inside the top 100.
DraftKings gives Spurs plus-500 odds of being relegated — around a 17% chance that’s actually even higher than that once you remove the vig.
 9. Aston Villa (unchanged)
Since we last did this, Villa have won the seventh-most points in the league and produced the eighth-best goal differential. I don’t think this ranking is too far off from what we should expect from them for the rest of the season.
 12. Brentford (down 2)
They’re still hanging around that Champions League battle — only five points back of Liverpool and Chelsea, who are tied on points for fifth.
One reason why they could do it, and why they’re better than these ratings suggest: They still have to play six of the seven bottom teams in these rankings.
 13. Nottingham Forest (down 2)
Forest were surprisingly good in their first two matches under Vitor Pereira. They absolutely annihilated Fenerbahce in Turkey, and then they outplayed a fully rested Liverpool for 85 minutes just a couple of days later. But more broadly, their performance level has been on the decline; their xG differential is now only slightly better than 17th-place West Ham’s, who have moved to within two points of Forest in the table.
I still think they’re a better team than West Ham — both on talent and overall play — but the gap is closing and they’re on the fourth manager of the season already. The bottom, still, could fall out.
 11. AFC Bournemouth (up 1)
Premier League teams located outside of Manchester with more points than Bournemouth over the past five matches:
•
No, I didn’t forget to type anything. I’m doing a bit.
 14. Fulham (down 1)
They’re a unique team that doesn’t press at all, yet also tries to build play slowly from the back. It’s a strange combination, and I’m not sure how effective of a combination it is, but it’s going to keep Fulham out of a relegation battle for the fourth year in a row.
 10. Crystal Palace (up 4)
They’re our biggest risers both because their underlying performances have been excellent, and they’ve started to inch away from that “no pressing and no possession” quadrant.
But much like Chelsea, they’ve also just been beating up on bad teams. They have the second-hardest remaining schedule from here, with matches against City, Arsenal, Liverpool, United and Newcastle still to come.
 15. Leeds United (unchanged)
Leeds are doing a weird thing that we don’t typically see: avoiding relegation by scoring a lot of goals.
They’ve conceded 46 goals — fewer than all but the bottom three teams in the table — and they’ve also scored only one fewer than Aston Villa. My “Daniel Farke for Manager of the Year” campaign marches on.
 16. Everton (unchanged)
Subjectively, I’d probably bump them up a couple of spots, but this isn’t a particularly talented team. They don’t press, they don’t keep the ball under pressure, and their xG differential is right around minus-7.
They’re also one of the three-oldest teams in the league. Changes are needed to avoid a potential relegation battle next season.
 18. Wolverhampton Wanderers (down 1)
For a lot of the season, they were a bad team with terrible results thanks to some historic bad luck. Now they’re just a no-doubt-about-it terrible team.
 17. West Ham United (up 1)
The biggest weakness of these rankings might be that they don’t weigh recent form heavily enough. The biggest strength of these rankings might be that they don’t weigh recent form too heavily. I think we’re all guilty of erring too far toward the former: Who hasn’t seen a team play a couple of good or bad matches, then thrown out everything that came before and declared them suddenly “fixed” or “broken?”
But as you see West Ham creeping up these ratings and Forest sliding down, you can both understand why there’s suddenly a relegation battle and why Forest, still, are sizable favorites to stay up for another season.
 19. Sunderland (unchanged)
Only Spurs and Wolves have fewer points since we last did this. Only Spurs, Wolves and Newcastle have a worse goal differential since we last did this. And only Burnley, Spurs and Wolves have worse xG differentials since we last did this. My guess is they finish the season somewhere around 15th place.
 20. Burnley (unchanged)
Burnley and Wolves play each other on the last day of the season. Why?